| Characteristic | Standard care N = 1201 |
Structured intervention N = 1201 |
p-value2 |
|---|---|---|---|
| Age, years | 60.9 (10.7) | 59.6 (10.2) | 0.3 |
| Sex | >0.9 | ||
| Female | 70 (58%) | 71 (59%) | |
| Male | 50 (42%) | 49 (41%) | |
| BMI, kg/m² | 28.4 (4.0) | 28.4 (4.4) | >0.9 |
| Smoking status | 0.5 | ||
| Current | 26 (22%) | 31 (26%) | |
| Not current | 94 (78%) | 89 (74%) | |
| Hypertension | 42 (35%) | 42 (35%) | >0.9 |
| Systolic blood pressure, mmHg | 137.7 (13.1) | 136.7 (14.2) | 0.6 |
| Pulse wave velocity, m/s | 9.6 (1.2) | 9.0 (1.4) | 0.001 |
| 1 Mean (SD); n (%) | |||
| 2 Welch Two Sample t-test; Pearson’s Chi-squared test | |||
Age and Arterial Stiffness Across Two Clinical Groups
Illustrative clinical analysis | Fully synthetic patient-level data
Synthetic clinical statistical analysis report featuring Table 1, age–PWV correlations, plots, and manuscript-ready Methods and Results.
Demonstration only. This report is generated from synthetic observations, not from clinical records. All estimates, confidence intervals, tests, tables, plots, and result statements are recalculated from the same dataset each time the parent site QMD is rendered.
1 Methods
1.1 Study design and simulated data
We generated an illustrative dataset of 240 independent synthetic observations divided equally between standard care and a structured intervention group (120 observations per group). Variables comprised age, sex, body mass index (BMI), current smoking, hypertension, systolic blood pressure, and carotid–femoral pulse wave velocity (PWV). The main illustrative analysis evaluated the cross-sectional relationship between age and PWV separately in each group. Group membership is used for stratification and visual comparison; no causal interpretation is intended.
1.2 Statistical analysis
Continuous variables were summarised as mean (standard deviation [SD]) and categorical variables as count (percentage). Baseline characteristics were compared between groups using Welch’s two-sample t-test for continuous variables and Pearson’s chi-squared test for categorical variables.
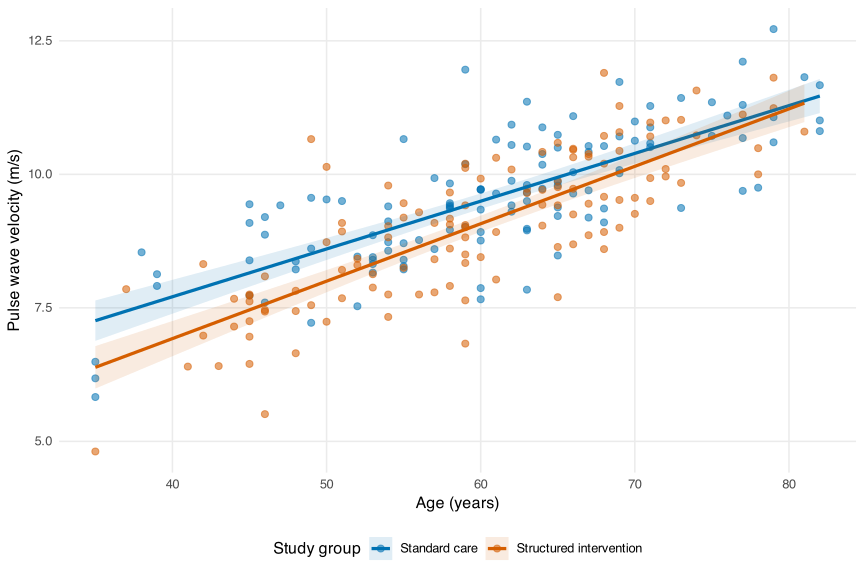
Within each group, the association between age and PWV was examined using Pearson’s product–moment correlation coefficient (r) with a two-sided test and Fisher-transformed 95% confidence interval (CI). Scatterplots were generated using ggstatsplot, with separate least-squares regression lines. An overlaid plot displayed both groups with different point and line colours; fitted lines and their 95% confidence bands were estimated separately by group.
An exploratory linear model containing age, group, and an age-by-group interaction was used to examine whether the slopes differed. All tests were two-sided; a nominal p value below 0.05 was considered statistically significant for descriptive illustration. No multiplicity adjustment or prospective power calculation was performed for this simulated example. Analyses were performed in R using ggstatsplot, ggplot2, gtsummary, and Quarto.
2 Results
2.1 Demographic and clinical characteristics
Demographic results. The analysis included 240 synthetic participants (120 standard care and 120 structured intervention), of whom 141 (58.8%) were female. Mean age was 60.9 ± 10.7 years in standard care and 59.5 ± 10.2 years in the structured intervention group (Welch test p = 0.330). The sex distribution was compared using Pearson’s chi-squared test (p = 0.896).
Mean PWV was 9.58 ± 1.25 m/s and 9.03 ± 1.38 m/s, respectively (Welch test p = 0.001). Group summaries and all remaining baseline characteristics are displayed in Table 1. These figures describe a simulated sample and should not be interpreted as treatment efficacy.
2.2 Association between age and arterial stiffness
2.2.1 Standard-care group
2.2.2 Structured-intervention group
2.2.3 Combined comparison of both groups
The group-specific ggstatsplot figures above are presented together in a single ggplot2 panel below so that both fitted lines can be compared directly without faceting. Point colours match their corresponding regression lines.
2.3 Correlation estimates
| Table 2. Age–PWV correlations by study group | ||||
| Study group | N | Pearson r | 95% CI | P value |
|---|---|---|---|---|
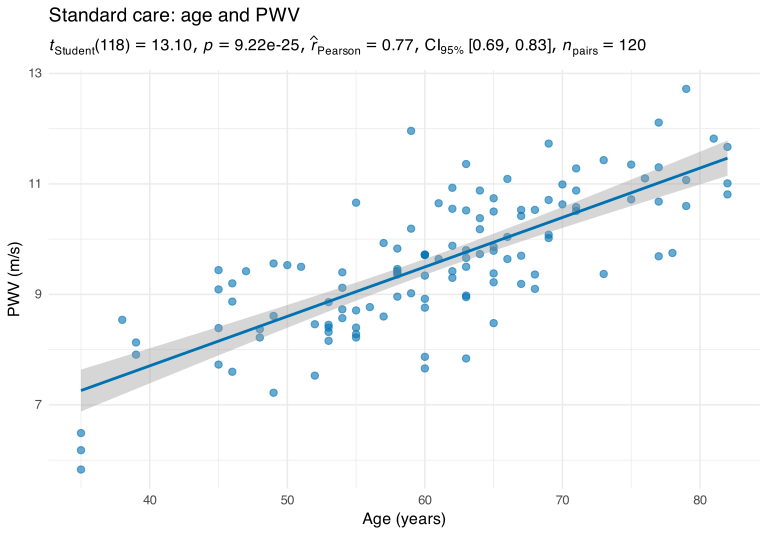
| Standard care | 120 | 0.770 | 0.685 to 0.834 | <0.001 |
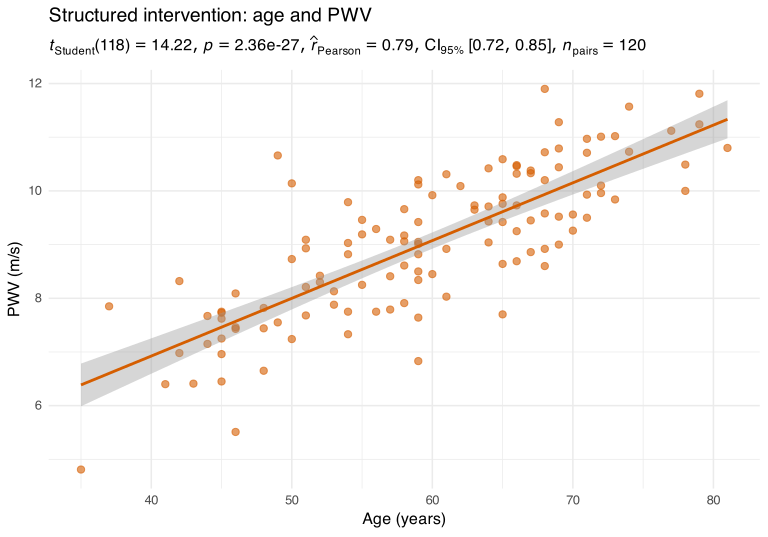
| Structured intervention | 120 | 0.795 | 0.718 to 0.853 | <0.001 |
| Pearson correlation, two-sided tests. Fisher-transformed 95% confidence intervals. | ||||
Correlation results. Within the standard-care group, age and PWV were associated with Pearson’s r = 0.770 (95% CI 0.685 to 0.834; p = <0.001; n = 120). In the structured-intervention group, the corresponding estimate was r = 0.795 (95% CI 0.718 to 0.853; p = <0.001; n = 120).
As shown in Figures 1 and 2, both groups displayed positive age–PWV relationships. Figure 3 displays both sets of observations and their group-specific regression lines on common axes. The exploratory age-by-group interaction test yielded p = 0.077; any apparent slope difference is descriptive and not evidence of a causal intervention effect. Exact within-group estimates are listed in Table 2.
3 Interpretation and reporting notes
The demonstration illustrates how a single reproducible workflow links the statistical methods, descriptive Table 1, group-specific scatterplots, overlaid two-group visualisation, Pearson correlation Table 2, and the accompanying Results paragraphs. In a real clinical study, assumptions, potential confounders, multiplicity, estimands, missing data, and study-specific reporting guidelines would require an analysis plan tailored to the research question.
İncelemeye devam edin — Diğer sentetik görselleri inceleyebilir veya çalışmanız için ön değerlendirme isteyebilirsiniz.